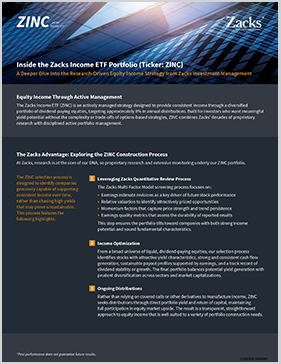
The Zacks Income ETF is the most income-focused ETF offered through Zacks Investment Management.
Supported by Zacks’ research discipline, the fund’s portfolio construction and ongoing active management processes prioritize income generation, with an eye to long-term total returns.
The Zacks Income ETF (the “Fund”) seeks to provide current income as well as long-term capital appreciation.
The fund pursues this objective by investing in companies with attractive dividend characteristics and strong cash flow profiles, the fund has a targeted annual distribution rate of 8%.
| Fund Inception | 6/1/2026 |
| Ticker | ZINC |
| Net Assets | 0.00 |
| Asset class | Equities |
| Shares Outstanding | 0 |
| Primary Exchange | NYSE |
| CUSIP | 98888G873 |
| Fund Type | Active |
| Benchmark |
Dow Jones US Select Dividend Total Return Index/Russell 1000 Value The Dow Jones U.S. Select Dividend Index represents the country’s top stocks by dividend yield, selected annually and subject to screening and buffering criteria. The index universe is defined as all dividend-paying companies in the Dow Jones U.S. Index that have a nonnegative historical five-year dividend-per-share growth rate, a five-year average dividend to earningsper-share ratio of less than or equal to 60%, paid dividends in each of the previous five years, and a three-month average daily trading volume of 200,000 shares. Current index components are included in the universe regardless of their dividend payout ratio or trading volume. The Russell 1000 Value Index is a well-known, unmanaged index of the prices of 1000 largecompany value common stocks selected by Russell. The Russell 1000 Value Index assumes reinvestment of dividends but does not reflect advisory fees. An investor cannot directly invest in an index. The volatility of the benchmark may be materially different from the individual performance obtained by a specific investor. |
| Net Expense Ratio | 0.55% ** |
| Gross Expense Ratio | 1.07% |
| Number of Holdings | |
| Dividend Frequency | Quarterly |
| NAV | |
| Net Asset Value | $ |
| Daily Change | % |
| Volume | 0 |
| Market Price | |
| Closing Price | $ |
| Daily Change | % |
| 30-Day Median Bid/Ask Spread | 0% |
| Premium/Discount | $ |
Month end returns as of: 06/30/2026
| 1 Month | 3 Month | 6 Month | Since Inception (6/2/2026) | |
| Fund NAV | - | - | - | - |
| Market Price | - | - | - | - |
Quarter end returns as of: 06/30/2026
| 1 Year | 3 Year | 5 Year | 10 Year | Since Inception (6/2/2026) | |
| Fund NAV | - | - | - | - | - |
| Market Price | - | - | - | - | - |
Net Asset Value Return represents the closing price of underlying securities.
Market Return is calculated using the price which investors buy and sell ETF shares in the market. The market returns in the table are based upon the midpoint of the bid/ask spread at 4:00 pm EST, and do not represent the returns you would have received if you traded shares at other times.


Submit the form below and a Zacks representative will reach out to answer any questions you have about Zacks ETFs.